Dashboard Design

Dashboard Design
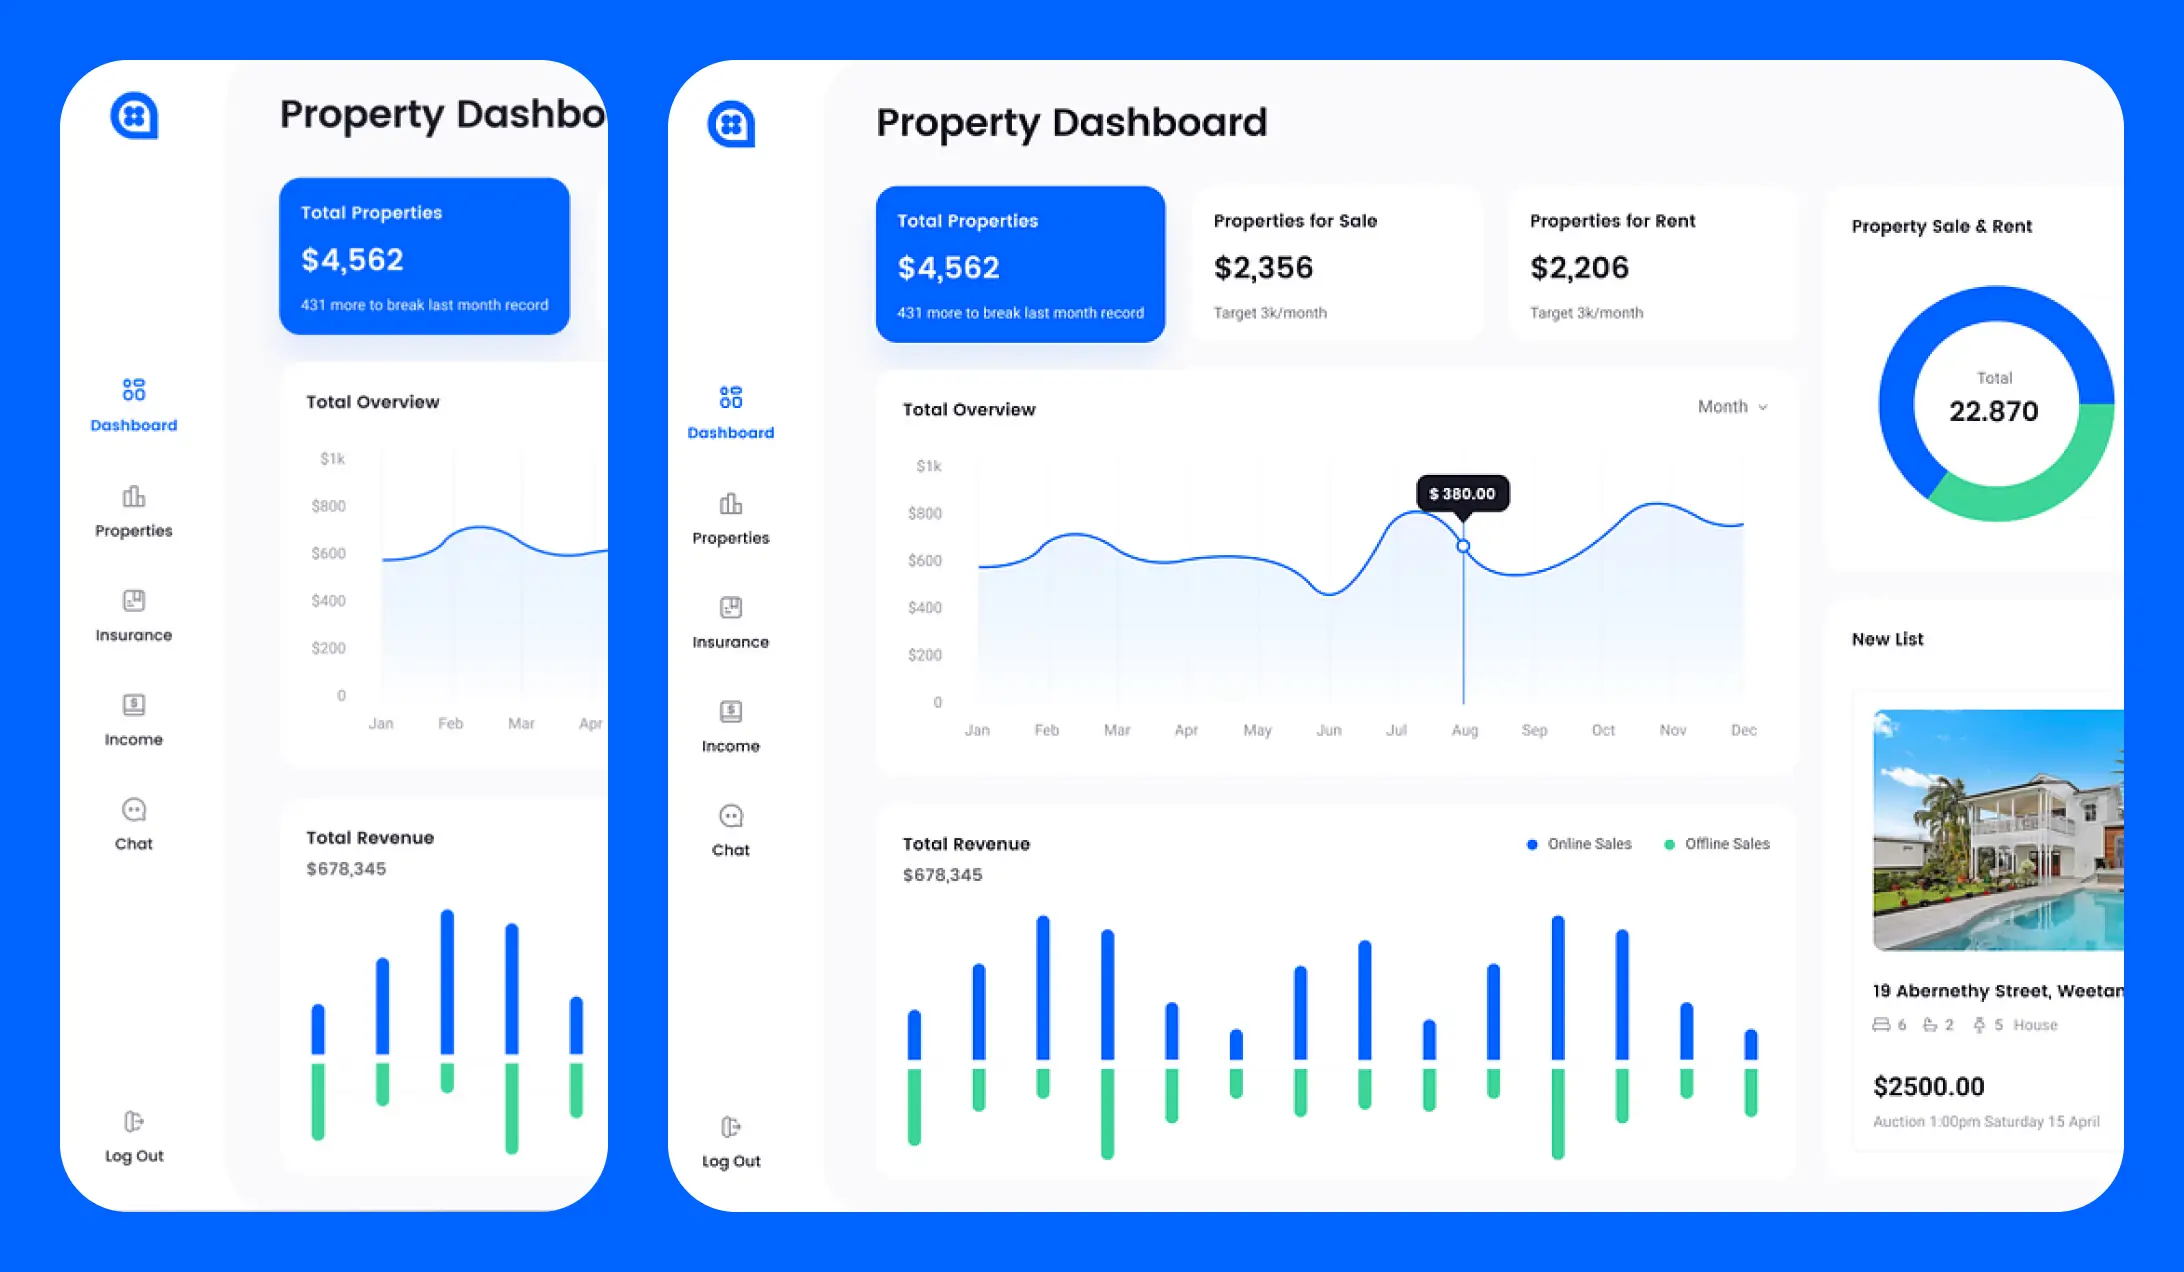
A dashboard is a visual representation of data and metrics that are important to a particular business process or activity. Effective dashboard design is critical to ensure that the data is easily understandable and actionable.
Here are some key principles for designing a dashboard:
- Clear objectives: Define the purpose and objectives of the dashboard.
- Simple and intuitive design: Use a simple and intuitive design that is easy to navigate.
- Relevant data: Only include relevant data that supports the objectives of the dashboard.
- Visual hierarchy: Use a visual hierarchy to draw attention to the most important data.
- Interactive elements: Incorporate interactive elements, such as filters and drill-down capabilities, to enable users to explore the data in more detail.
Some popular dashboard design tools include:
- Tableau: A data visualization tool that connects to various data sources.
- Power BI: A business analytics service by Microsoft that provides interactive visualizations.
- D3.js: A JavaScript library for producing dynamic, interactive data visualizations.


